Receptor Summary
         10         20         30         40         50         60         70         80         90        100
 MFSPADNIFI ILITGEFILG ILGNGYIALV NWIDWIKKKK ISTVDYILTN LVIARICLIS VMVVNGIVIV LNPDVYTKNK QQIVIFTFWT FANYLNMWIT
        110        120        130        140        150        160        170        180        190        200
 TCLNVFYFLK IASSSHPLFL WLKWKIDMVV HWILLGCFAI SLLVSLIAAI VLSCDYRFHA IAKHKRNITE MFHVSKIPYF EPLTLFNLFA IVPFIVSLIS
        210        220        230        240        250        260        270        280        290        300
 FFLLVRSLWR HTKQIKLYAT GSRDPSTEVH VRAIKTMTSF IFFFFLYYIS SILMTFSYLM TKYKLAVEFG EIAAILYPLG HSLILIVLNN KLRQTFVRML
        310        320        330        340        350        360        370        380        390        400
 TCRKIACMI
Protein Diagram
When using this 2D protein diagram,please cite:
Protter: interactive protein feature visualization and integration with experimental proteomic data.
Omasits U, Ahrens CH, Müller S, Wollscheid B.
Bioinformatics. 2014 Mar 15;30(6):884-6. doi: 10.1093/bioinformatics/btt607
Click here to view the paper:
Protter paper
Citations:
Promiscuity and selectivity of bitter molecules and their receptors. Bioorg Med Chem 23 (2015) 4082-4091.
doi: 10.1016/j.bmc.2015.04.025
3D Visualizer: NGL, A WebGL Protein Viewer
AS Rose and PW Hildebrand. NGL Viewer: a web application for molecular visualization. Nucl Acids Res (1 July 2015) 43 (W1): W576-W579.
doi: 10.1093/nar/gkv402
Jumper, J., Evans, R., Pritzel, A. et al. Highly accurate protein structure prediction with AlphaFold. Nature 596, 583–589 (2021). doi: 10.1038/s41586-021-03819-2
Mihaly V., Stephen A., Mandar D. et al. AlphaFold Protein Structure Database: massively expanding the structural coverage of protein-sequence space with high-accuracy models, Nucleic Acids Research, Volume 50, Issue D1, 7 January 2022, Pages D439–D444, doi: 10.1093/nar/gkab1061
Category
Name
PUBCHEM
Structure
Reference
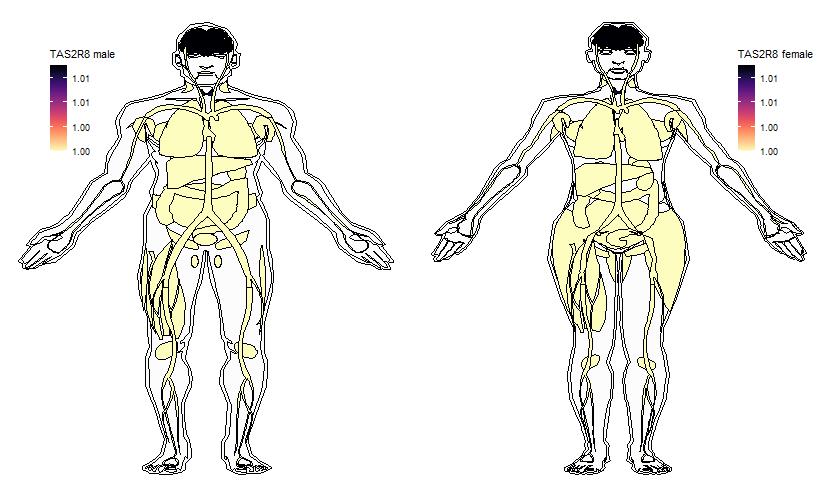
Ectopic expression of some Receptors in a variety of tissues was drawn using R gganatogram package, based on a comprehensive expression analysis with Next Generation Sequencing (NGS) technique (View more). Expression data are taken from the table-Expression profile of all genes in 16 different human tissues. Original values are added by one to show a log10 transformed profile.
